Product Insights
The Assay Technology 571 Formaldehyde Monitor
When customers ask about our Formaldehyde (Aldehyde) Monitor, the 571, we know this chat is Read More …
When customers ask about our Formaldehyde (Aldehyde) Monitor, the 571, we know this chat is Read More …
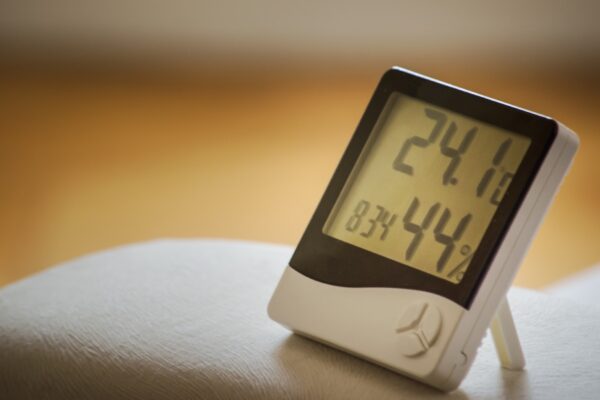
Assay Technology badges have been validated to work as claimed under normal office/factory conditions. For Read More …

Currently Seeking a Lab Assistant Assay Technology in Boardman, OH seeks a 40 hour per Read More …
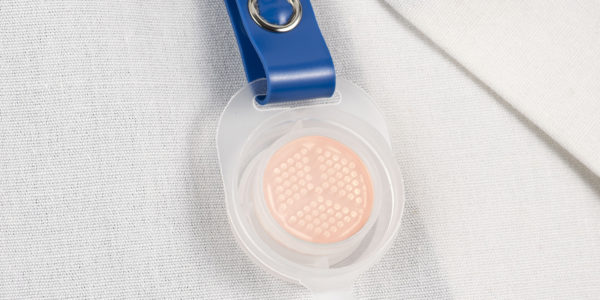
Assay Technology maintains a long-held position as the technology leader for personal monitoring of chemicals in the workplace.
Read More
As the technology leader in personal monitoring badges, Assay Technology's role extends from developing and manufacturing the monitors all the way through the analysis of samples. Our three AIHA-LAP, LLC accredited labs provide personal air samplers to industrial hygienists and analyze the contents of returned samplers. By handling every step of the process, we are able to provide the most convenient and cost-effective service to our customers.
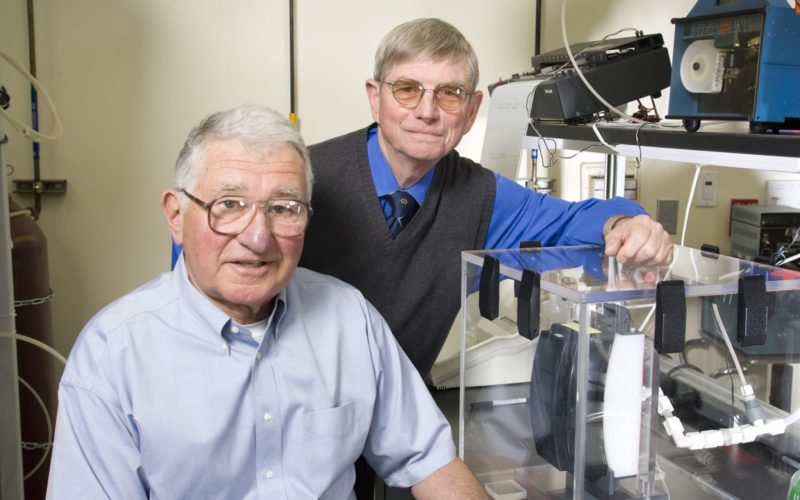
Read MoreMiller-Nelson Laboratory has been testing air purifying respirators since 1972 and has performed over 17,000 individual tests using over 450 different materials. Currently we perform all the NIOSH and European gas and vapor respirator qualification tests for the vast majority of respirator manufacturers, as well as their suppliers of sorbents. We also have provided service life information to over 500 end users.
Learn MoreCompleting your Lab Request Form with this app is a snap! Plus, get access to your reports 24/7. Free download on Google Play (Android). Learn more!